What is real-browser load testing?
Real-browser load testing runs each virtual user in its own real, isolated browser, then drives many of them through a journey at the same time to see how the site holds up under load. A virtual user is one simulated visitor the test controls. Because a real browser loads the page, runs JavaScript, and renders the result, the test records what that controlled browser saw under the selected conditions, not just how quickly the server replied.
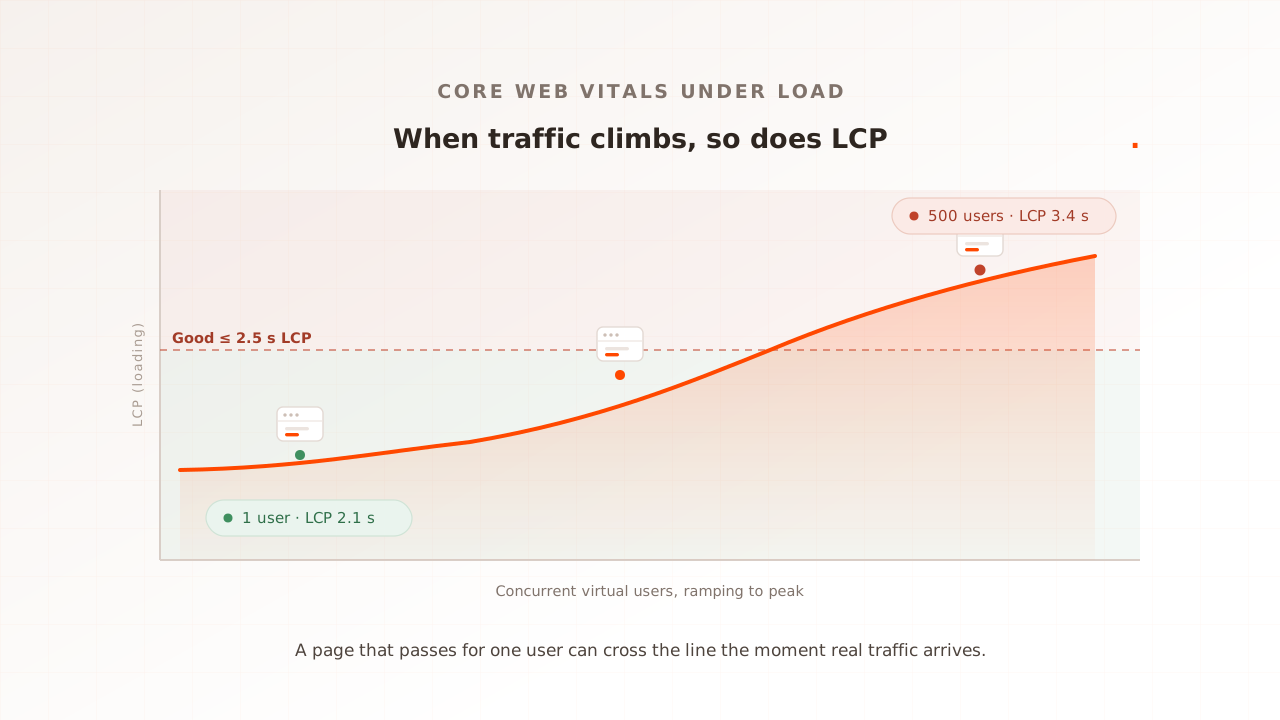
That is the whole idea. Every virtual user is a real browser. Each one has isolated session state, including cache and cookies. When 500 of them hit your checkout at once, they stress the shared backends, CDNs, and third parties that real traffic would stress, while each browser records its own rendered experience under the selected test conditions.
Two clarifications people ask about. “Real” does not require a visible window: a modern headless browser still runs the rendering and JavaScript engine and can produce browser metrics such as Core Web Vitals. And “isolated” is the load-bearing word, because each virtual user gets a separate browser instance rather than sharing one process with many simulated users.
The contrast is with the older approach, which sends HTTP requests to the server and never opens a browser at all. Both are useful, but they answer different questions. A real browser captures Core Web Vitals (Largest Contentful Paint, Interaction to Next Paint, Cumulative Layout Shift) natively, the same way the user’s own browser would, and it runs every third-party tag on the page. A request-only test sees none of that, because the things that produce it never execute.
To see what one controlled browser records on your page right now, run our website speed test: Evaluat Pulse loads the page once in a real browser, returns LCP, CLS, FCP, and TTFB with Evaluat’s A to F composite grade, and keeps a video of the load on a shareable link. A single cold load does not produce a representative INP. A real-browser load test extends that controlled measurement across isolated browsers at your selected concurrency.
What are the three load-testing models?
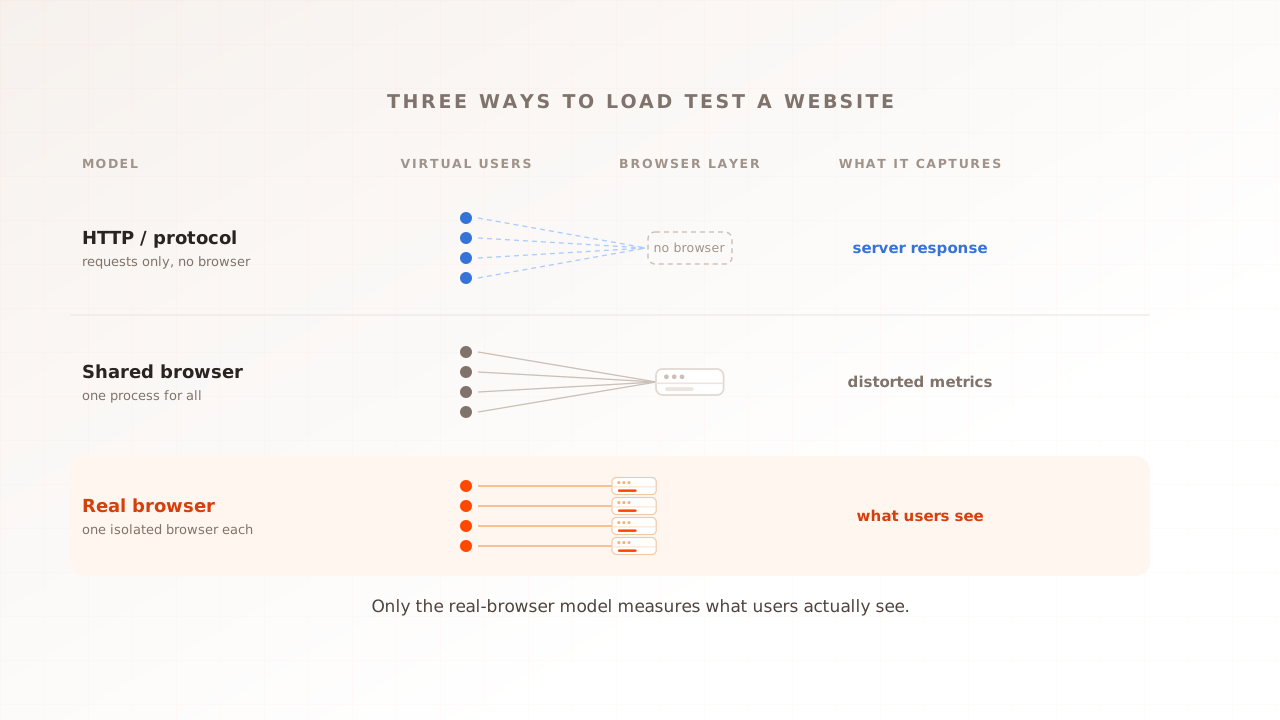
Load testing tools fall into three architectural models. They measure different things and they are not interchangeable, so the first decision is which model fits the question you are asking.
HTTP-script (protocol) load testing
The original model and still the most common. The tool sends HTTP requests straight to the server, paces them in code to mimic users, and measures the server’s response. k6, JMeter, Gatling, and Locust are the well-known examples. It is cheap, fast, and accurate for what it measures: requests per second, response-time distributions, error rates, and status codes.
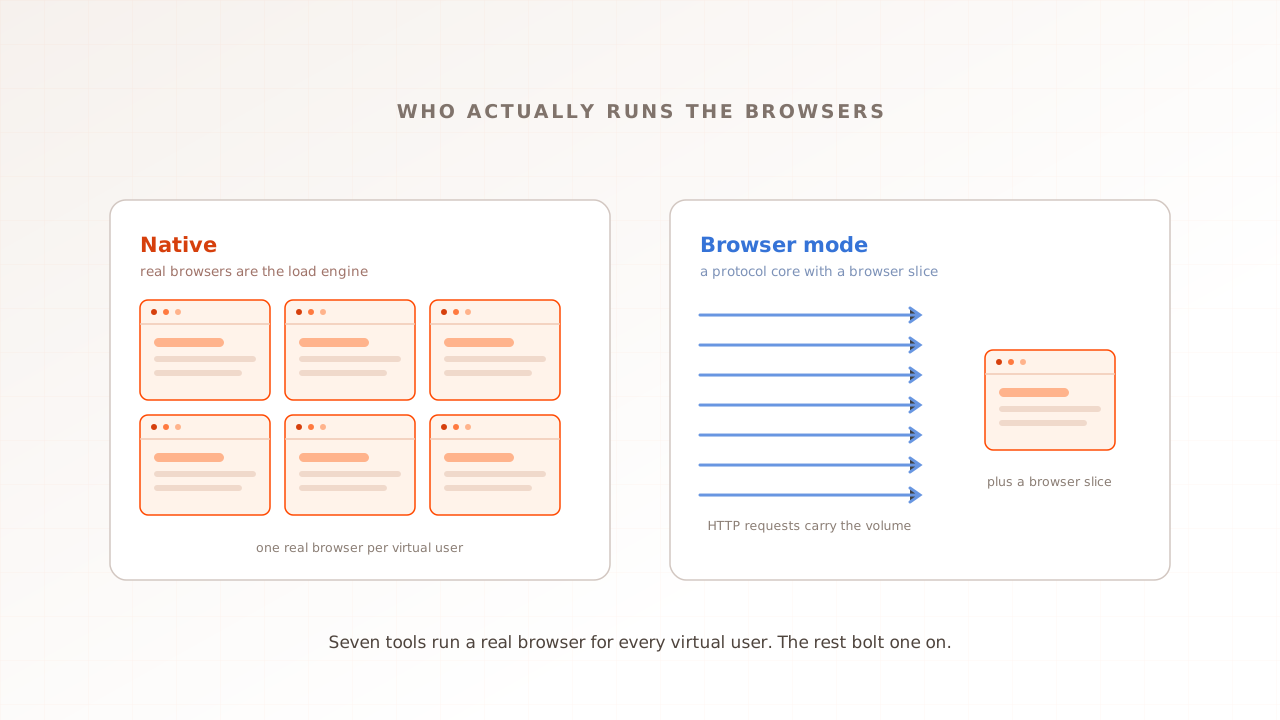
What this model does not do is run a browser. There is no HTML parsing, no JavaScript execution, and no rendering, so Core Web Vitals are unmeasured and third-party tags never load. That is a property of the model, not a knock on the tools, and it is exactly what makes protocol testing so cheap per virtual user. Some of these tools also reach past the protocol layer: k6, for example, ships a browser module that drives a real headless Chromium, runs your JavaScript, and reports Core Web Vitals such as LCP and INP (k6 docs). That is a different mode from its HTTP-script core, and it sits closer to the third model below.
Shared-browser load testing
A middle ground. One browser process handles many simulated users by running several scenarios in parallel inside the same instance. It is lighter on infrastructure than a browser per user. JavaScript runs, the DOM renders, and you can capture screenshots.
What you do not get is realistic contention. One browser doing a hundred things at once behaves nothing like a hundred independent browsers doing one thing each: the CPU profile, the memory profile, and the cache behaviour are all different. The Core Web Vitals that come out are distorted rather than wrong, and they do not reliably reflect what real users would see. Treat shared-browser tools as functional check harnesses, not as load-testing instruments.
Real-browser load testing
Each virtual user runs in its own isolated browser. You get what those controlled browsers recorded under the selected test conditions: Core Web Vitals captured in-browser, third-party tag impact because the tags actually run, and per-session evidence (video, network log, console log, step timings). The result is not identical to every customer’s device or field CrUX. What you do not get is API-layer or protocol-level coverage, or the cheapest possible compute per virtual user.
| HTTP-script (protocol) | Shared browser | Real browser | |
|---|---|---|---|
| Runs a real browser | No | One, shared by many users | Yes, one isolated per user |
| Executes your JavaScript | No | Yes | Yes |
| Captures Core Web Vitals | No | Distorted | Yes, natively |
| Sees third-party tags | No | Partially | Yes, they actually run |
| Per-session video and logs | No | No | Yes |
| Compute cost per virtual user | Lowest | Low | Highest |
| Best suited to | APIs and protocols | Functional checks | User-facing pages under load |
Why isn’t server response time the user’s experience?
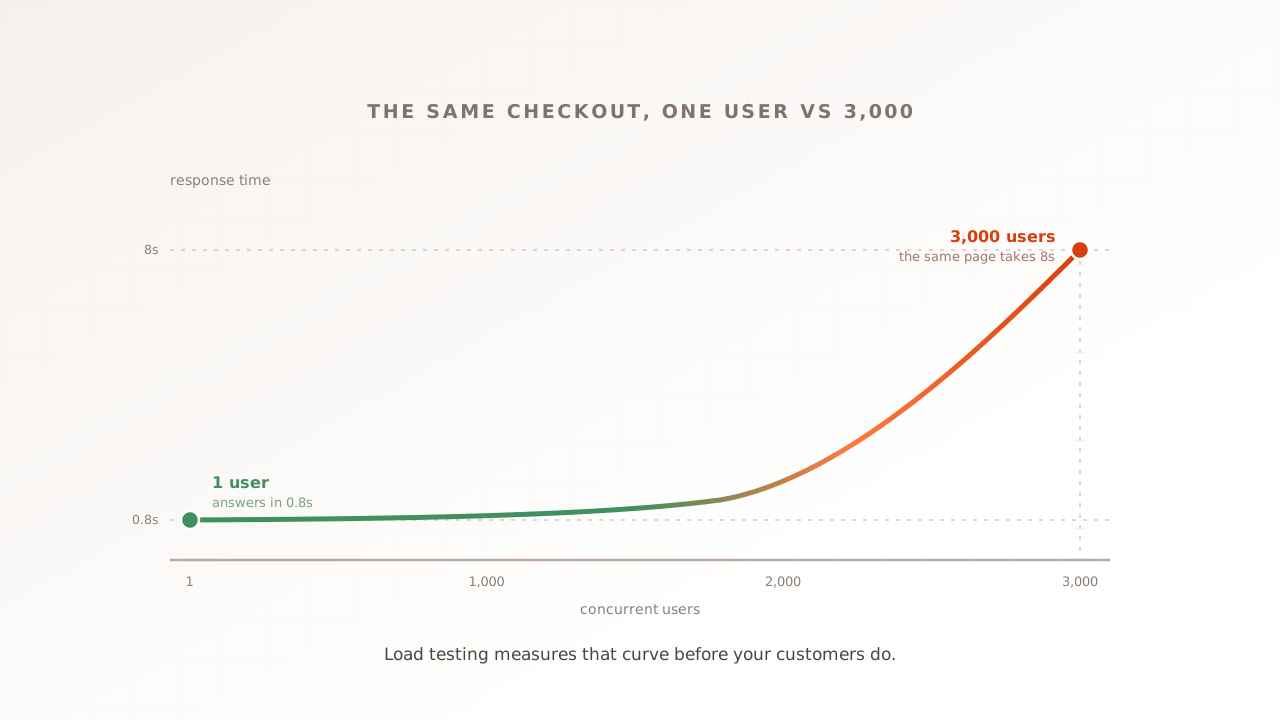
Because the server’s reply is only the first slice of what the user waits for. After the first byte arrives, the browser still has to download and parse the HTML, run the JavaScript, load every third-party tag, and paint the result. A fast server is necessary but not sufficient, which is why a good Time to First Byte is, in Google’s words, only a “rough guide”: a server-rendered page can post a higher TTFB yet a better Largest Contentful Paint than a client-rendered one, because the work that matters happens in the browser.
Third parties are the clearest example of what a request-only test misses. In 2024, 92% of pages used at least one third party, and scripts made up 30.5% of third-party requests. Analytics, consent banners, A/B testing, and chat widgets only run inside a browser, so a test with no browser never loads them, never executes them, and never measures the delay they add. The tags that most often wreck a real user’s experience are invisible to the model that only talks to the server.
The field bears this out. In 2024, only 43% of mobile sites and 54% of desktop sites passed the Core Web Vitals assessment, close to half the web shipping an experience Google rates as needing improvement or worse, almost all of it decided in the browser rather than at the server. And the front end pays the bill: in a 2020 Deloitte study commissioned by Google, retail sites that improved mobile speed by 0.1 seconds saw conversions rise 8.4% and average order value rise 9.2% on average. (The study moved four timing metrics together across the journey, so read it as speed correlating with revenue, not one dial you turn.) For the metrics themselves, see Interaction to Next Paint explained.
When is real-browser load testing the right call?
Pick the model by the question you need answered. Real-browser testing is the right call when the answer lives in the browser, and a protocol tool is the right call when it lives at the server or the API.
- “Will the page stay fast for users at peak?” Real-browser. An HTTP-script test confirms the server stayed fast, which is not the same question.
- “Which third-party tag is costing us 600ms of LCP?” Real-browser. The tag has to run for you to measure it.
- “What did a browser in conditions chosen to represent a key market see?” Real-browser. You need the full rendering pipeline, while field data remains the source for the full device and network distribution.
- “Can our checkout survive 5,000 concurrent users?” Real-browser if the survival metric is user-visible (LCP, INP, completed sessions); HTTP-script if it is purely backend (connection pools, error rate, queue depth). For a concrete storefront version of this split, see how we load test a Magento store.
- “Can our /api/orders endpoint handle 50,000 requests per second?” HTTP-script. There is no browser to run, so a real one is wasted overhead.
The honest answer for most teams is both. Use a protocol tool against the API surface, where it is genuinely the better and cheaper instrument, and a real-browser tool against the customer-facing journey. They report on different layers of the same system. For a side-by-side with a popular protocol load tool, see Evaluat vs JMeter; to turn a real-browser run into a release gate, see performance regression testing.
What does real-browser load testing cost, and how does it scale?
It costs more per virtual user than protocol testing because a real browser is a full runtime and an HTTP client is much lighter. LoadView’s Playwright guidance uses roughly one CPU core per concurrent browser as a starting rule of thumb, but real capacity depends on the page, browser settings, and the headroom needed to keep the generator from distorting results. Scale browser fleets horizontally, and validate generator health during every run. For very high request volume against a bare API, use a protocol tool.
The open-source route exists and is worth understanding before you buy. Playwright and Puppeteer drive real browsers programmatically, and you can build a load harness around either; k6’s browser module captures Core Web Vitals directly. What most teams find is that the saving moves rather than disappears. Operating a browser fleet means managing browser pools, capturing video, aggregating logs, and rendering reports, and over-packing browsers onto a generator degrades the very Vitals you are trying to measure. Hosted real-browser platforms exist to absorb that operational cost and scale the fleet horizontally. We keep a current shortlist of them in the best real-browser load testing tools.
How Evaluat approaches real-browser load testing
Evaluat is built on the real-browser model. It runs each virtual user in its own isolated browser, captures LCP, INP, CLS, and First Contentful Paint per session under load, and keeps the evidence: a video of every session, a network log of every request, and a console log of every message. You build the journey once in a visual scenario editor, with no scripting, and reuse it across runs and regions.
The forensic detail is the point. Aggregate percentiles tell you something is wrong; they do not tell you who or why. If 14 sessions out of 42,000 stalled at checkout, the p99 will not surface them, but the per-session evidence will. A failure at peak isn’t a percentile. It’s a session. You open the worst one, watch the video, read the console error, and see the third-party request that fired on the slow step. The expensive part of debugging a load incident is finding the broken user; this puts that user, with their full session, next to the aggregate that flagged the problem.
The honest boundary holds here too. Evaluat tests the customer-facing pages, not your gRPC services or your message queues. For those layers a protocol tool is the right instrument, and the two fit together cleanly. The methodology for measuring Vitals at realistic concurrency lives in Core Web Vitals at load.
Common mistakes
A few habits lead teams to test the wrong thing or trust the wrong number.
- Reading server numbers as user experience. A green HTTP-script run means the server held up. It says nothing about whether the page stayed fast, because the browser work happens after the response.
- Using shared-browser tools as load instruments. One browser running many scenarios produces contention that does not match many independent browsers. It is a functional check, not a measure of what users feel at scale.
- Testing the front end with a single user. One browser does not create load on shared backends, CDNs, or third parties, so it cannot show how their latency changes at peak. Independent customer devices do not share a CPU.
- Forgetting third-party tags. They only run in a real browser. If your test has no browser, the analytics, consent, and chat scripts that often dominate real-world slowness are simply absent from the result.
- Over-packing browsers onto a generator. Run too many real browsers on one machine and the rig starves them, degrading the Vitals you are measuring. The measurement needs headroom to stay honest.
Real-browser load testing is not the cheapest model, and it is not the right one for a bare API. It is the only model that measures what your customers’ browsers actually do when traffic arrives, which for a user-facing page is the number that decides whether they stay. Match the model to the question, keep a protocol tool for the API surface, and put a real browser on the journey that carries your revenue.
Book a demo to rehearse a critical journey in real browsers.