What is load testing?
Load testing is a way to measure how a website, app, or server behaves when many people use it at the same time. You simulate a realistic number of concurrent users, send that traffic at the system, and watch whether pages stay fast and requests keep succeeding. The goal is to answer one practical question before your real users do: will this hold up at the traffic we expect?
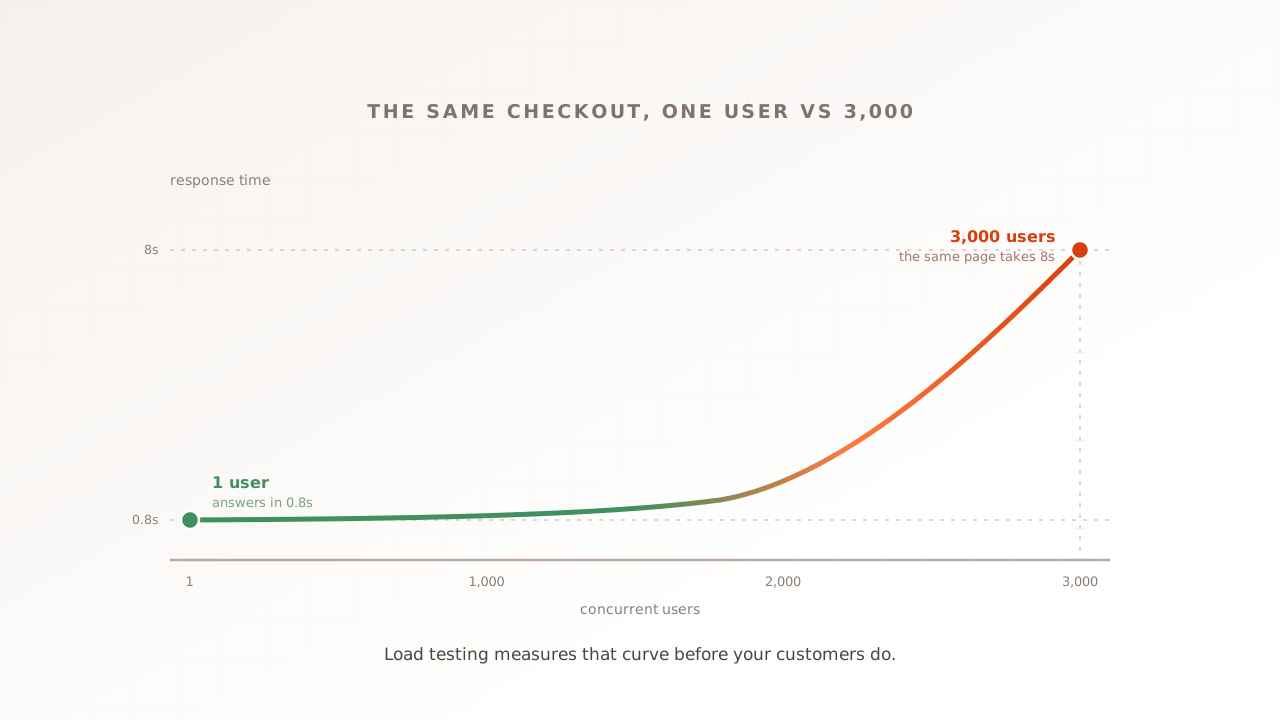
A single person clicking through a checkout tells you the feature works. It tells you nothing about what happens when 3,000 people hit that same checkout in the same ten minutes. Software that is fast for one user can crawl, queue, or fall over under a crowd. Database connections run out, servers spend all their time waiting, and a page that loaded in under a second in testing takes eight seconds when the load arrives. The patience for that is thin: Google’s DoubleClick research found that 53% of mobile visits are abandoned when a page takes longer than three seconds to load (2017). Load testing surfaces those failures in a controlled run, where fixing them is cheap, instead of in production, where it is not.
Think of it like a bridge. An engineer does not certify a bridge by walking across it alone; they load it to the weight it will actually carry, plus a margin, and measure how it responds. Load testing applies the same idea to software: apply the expected load deliberately, then read the results.
A few terms you will meet throughout this guide. A virtual user is a simulated visitor the test tool drives through your site in place of a real person. Concurrency is how many of those users are active at the same moment. Throughput is how many requests the system handles per second. Response time is how long the system takes to answer. Load testing is the discipline of choosing those numbers honestly and reading what comes back.
Why does load testing matter?
Load testing matters because slow and failing pages cost real money, and pages slow down precisely when traffic is high. Catching that in a controlled run is cheap; discovering it during a launch or a sale is not. The payoff is concrete: fewer abandoned visits, more completed conversions, and no outage at your busiest, most expensive moment.
The effect is measurable. When Google commissioned Deloitte and the agency fifty-five to analyze more than 30 million user sessions across 37 leading European and American brand sites, the study found that improving mobile site speed by just 0.1 seconds lifted retail conversions by 8.4% and average order value by 9.2%, with travel conversions up 10.1% (2020). A tenth of a second moved real revenue. Speed under load is not a vanity metric; it is a line on the income statement.
The downside is just as concrete. Google and SOASTA’s 2017 mobile benchmarks found that as page load time grows from one second to three, the probability that a visitor bounces rises by 32%; from one second to five, it rises by 90%. The visitors you paid to acquire leave before the page finishes loading. Under real load, the pages that were fast in development are exactly the ones that slow down, so the bounce risk is highest precisely when traffic, and the revenue behind it, is highest.
Conversion follows the same curve. Portent’s analysis of more than 100 million page views found that pages loading in one second converted at 3.05%, falling to 1.12% by three seconds (2022). Almost two-thirds of the conversion rate disappeared in the two seconds it took the page to slow down. The point of a load test is to find out, before a sale or a launch, whether your pages stay in that fast band when the crowd arrives.
There is an operational cost too, separate from conversions. An outage during a launch or a sale is the most expensive kind: maximum traffic, maximum attention, minimum room to fix things calmly. Load testing moves that discovery earlier. Catching a checkout that buckles at 2,000 concurrent users in a staging run costs an afternoon. Discovering it live during a flash sale costs the sale.
Load testing ties to three outcomes you already own:
- Conversion. Pages that stay fast under load keep more of the visitors you paid to bring in.
- Releases. A load test in your pipeline is a gate: regressions get caught before they ship, not after.
- Incidents. Knowing your breaking point ahead of time turns a 3 a.m. surprise into a planned capacity decision.
How does load testing work?
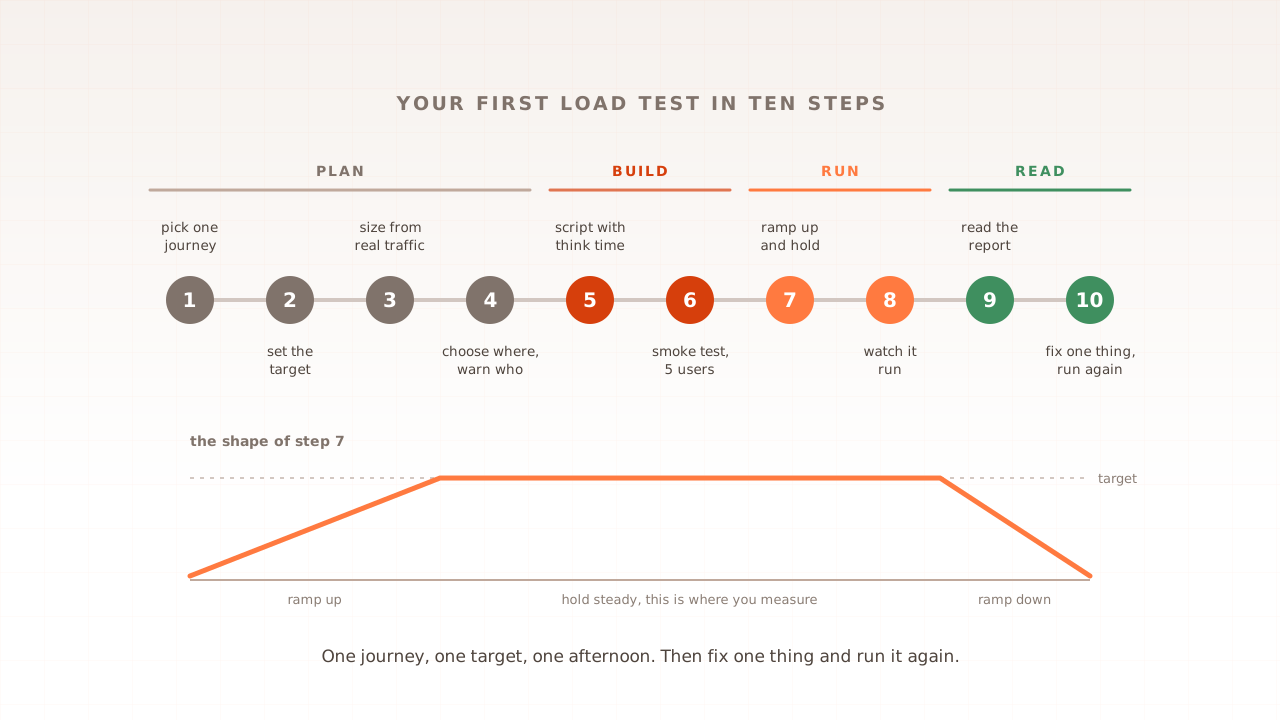
Every load test, whatever the tool, follows the same shape. You define what to test, simulate users doing it, apply load in a controlled pattern, and read the results. The mechanics break into four moving parts.
1. The scenario
A scenario is the user journey you want to put under load: the sequence of steps a real visitor takes. “Open the homepage, search for a product, add it to the cart, check out” is a scenario. You build it once. The test tool then replays it for every virtual user. A good scenario mirrors real behavior, including the pauses (called think time) a human takes between clicks, because a test with no think time hammers the server unrealistically.
2. The load profile
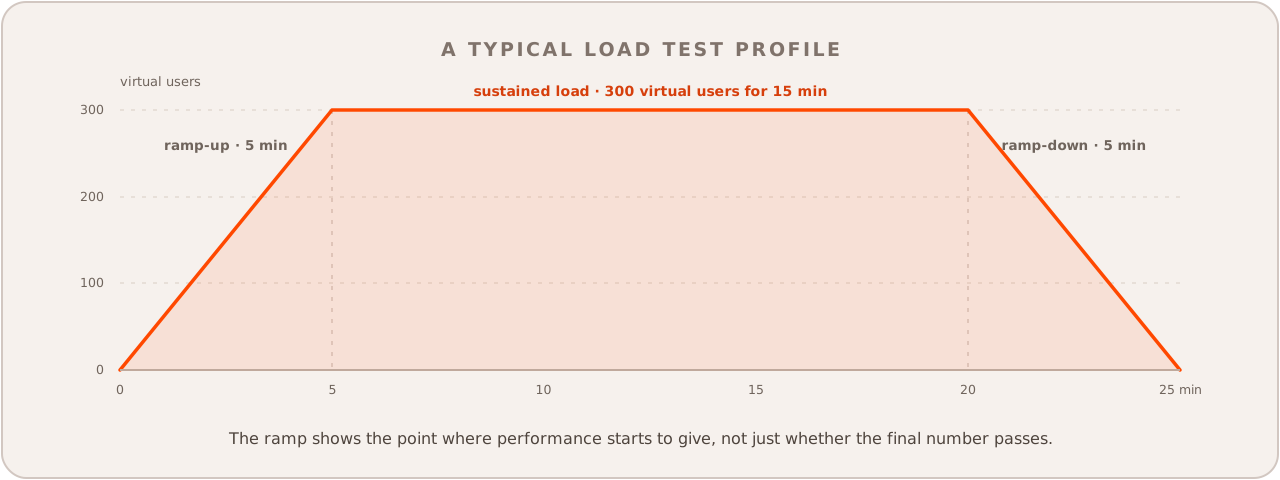
The load profile is how you apply traffic over time. You rarely drop full load instantly. A typical profile ramps up gradually, holds at a target plateau, then ramps down. For example: ramp from 0 to 300 virtual users over five minutes, hold 300 for fifteen minutes, then ramp down. The ramp lets you see at what point performance starts to degrade, not just whether the final number passes.
3. The run
During the run, the tool drives every virtual user through the scenario at the same time and records what happens. A concrete shape: 300 virtual users hitting the checkout journey for ten minutes, each pausing a few seconds between steps, all running concurrently. The system under test sees something close to a real crowd, and the tool measures its response under that crowd.
4. The metrics
After the run you read the results. The core numbers are response time (often shown as percentiles like p50, p95, and p99, because averages hide the slow tail), throughput in requests per second, error rate, and the count of successful versus failed sessions. The percentiles matter: a p50 of 800ms with a p99 of 9 seconds means most users were fine and one in a hundred had a terrible time. Under load, that tail is where the failures hide.
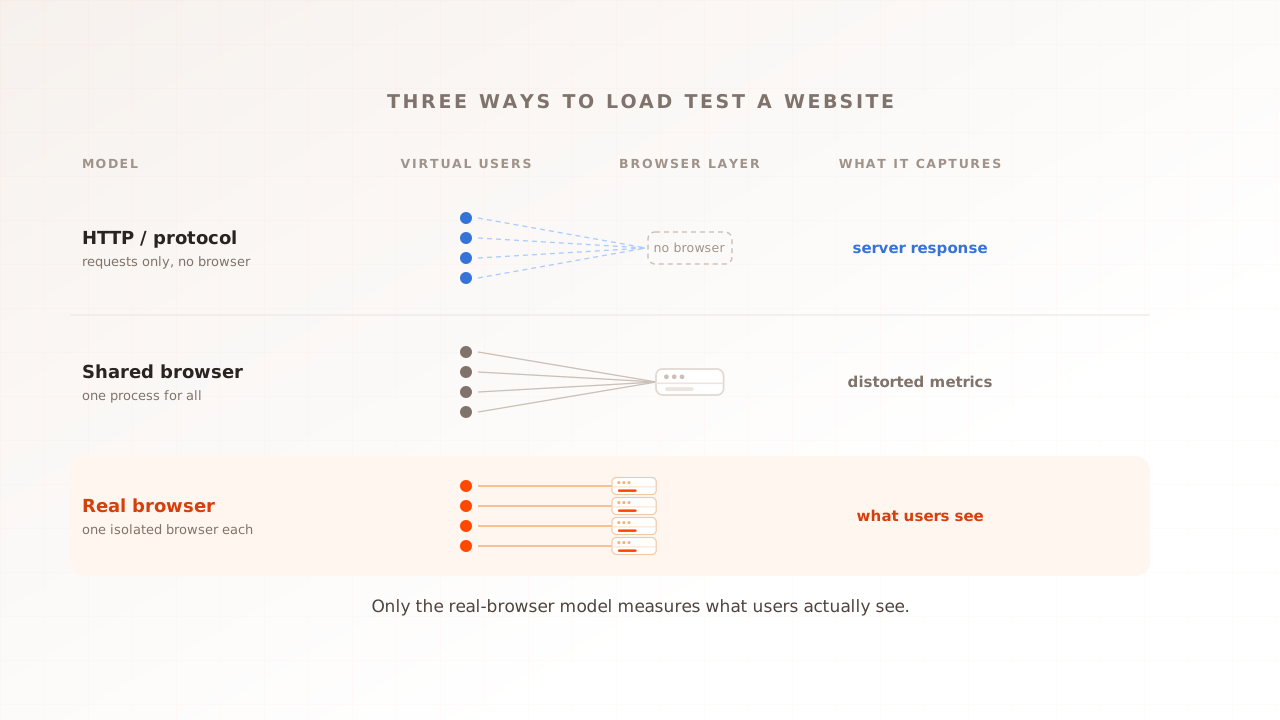
One distinction shapes everything you can measure here. Protocol-level tools send raw HTTP requests and time the server’s response. They are efficient and accurate for what they measure, but they never run a browser, so they cannot tell you what the page looked like or how long it took to become usable. Real-browser tools run an actual browser for each virtual user, so they capture rendering, JavaScript execution, and the Core Web Vitals a real visitor experiences. A fast server response does not guarantee a fast page; the two models measure different things, and which one you need depends on the question you are asking. If you are choosing between them, the best real-browser load testing tools guide maps which tools run each model.
That gap is not hypothetical. The HTTP Archive Web Almanac found that in 2024 only 43% of websites delivered a good Core Web Vitals experience on mobile (54% on desktop). Most of the web is already slow for real visitors before any extra load arrives. A test that only watches server response time will report green while those user-visible numbers are red.
Load testing vs stress testing: what is the difference?
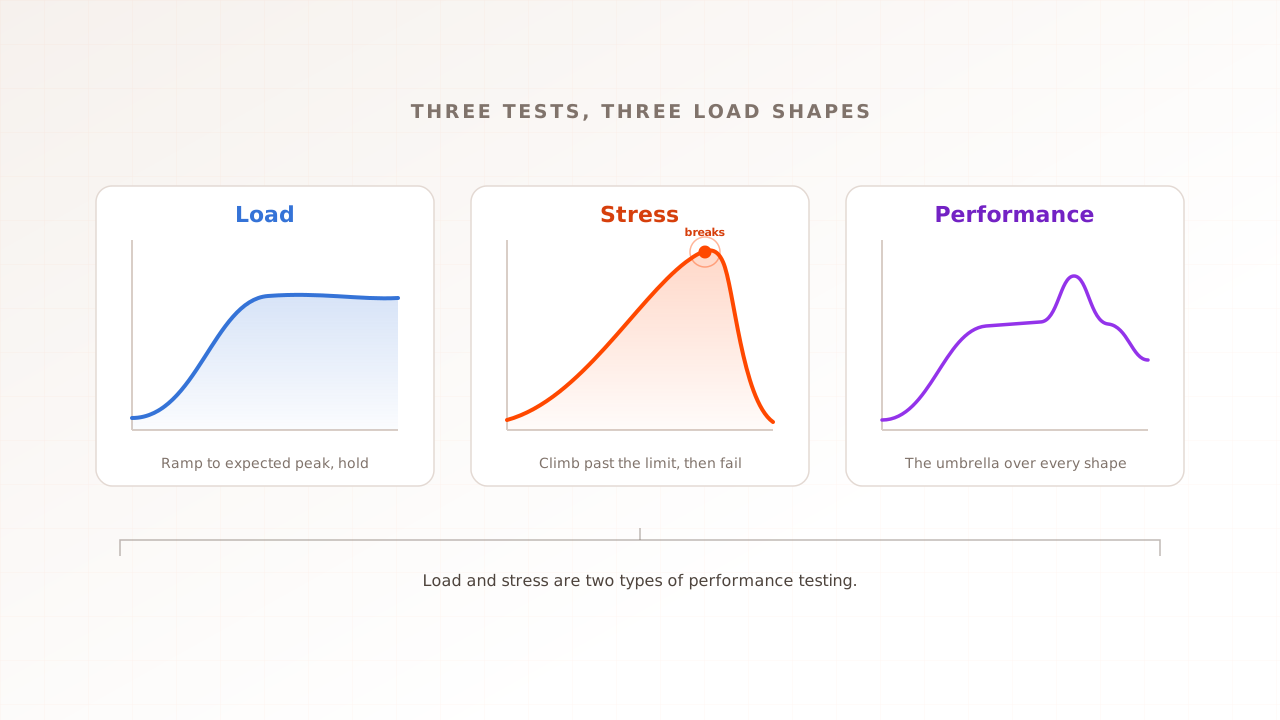
Load testing and stress testing use the same tools but answer opposite questions, and beginners mix them up constantly. Load testing applies the traffic you expect and confirms the system meets its targets. Stress testing deliberately pushes past that level to find where the system breaks and to watch how it fails. One validates the normal case; the other maps the failure case.
| Load testing | Stress testing | |
|---|---|---|
| Goal | Confirm the system meets targets at expected traffic | Find the breaking point and observe failure behavior |
| Traffic level | Expected peak, plus a small margin | Far beyond expected peak, until something gives |
| Question answered | ”Will we be fine on a normal busy day?" | "What happens on our worst day, and how do we recover?” |
| Typical outcome | Pass or fail against a performance budget | A measured capacity ceiling and a failure mode |
These are two members of a larger family. Spike testing throws a sudden surge at the system (the launch-day pattern). Soak testing holds a moderate load for hours to catch slow problems like memory leaks. All of them sit under performance testing, the umbrella term for any test that measures speed and stability under conditions. Load testing is the one focused on expected traffic, and it is usually the first one a team runs.
How many virtual users do you need?
Size your test from real concurrency, not from your total user count. The number you want is how many people are active at the same moment during a busy period, then a margin on top. A site with 100,000 monthly visitors might only ever have a few hundred of them on the site at once; you test the few hundred, not the hundred thousand.
There are two practical ways to arrive at a number, and a rule for starting.
- From real concurrency. Look at your analytics for peak concurrent sessions during your busiest hour, then add a margin of 20 to 50 percent for headroom and growth. If your peak is 800 concurrent users, test at roughly 1,000 to 1,200.
- From a target request rate. Little’s Law says average work in the system equals throughput multiplied by average time in the system. At 100 requests per second and a 200-millisecond response time, about 20 requests are in flight on average. That does not mean 20 virtual users: a user may pause, make several requests per page, or wait through a multi-step journey. Size virtual users from the observed iteration rate and think time of your scenario, then validate that the run produces the target request and transaction rates.
- The starting rule. Whichever number you target, begin with one virtual user. Confirm the scenario runs end to end and the responses are correct. Then ramp: 1, then 100, then your target. A failing test at one user is a broken script, not a capacity problem, and finding that out at scale wastes a run.
| Your situation | Reasonable starting load |
|---|---|
| First test, validating the script | 1 virtual user |
| Normal business-as-usual check | Expected peak concurrency |
| Pre-launch or pre-sale confidence | Peak concurrency plus 20 to 50 percent |
| Finding the ceiling (stress) | Ramp past peak until performance degrades |
The goal of the first runs is not a perfect number. It is a realistic, defensible one you can re-run every release and compare against.
Common mistakes with load testing
Most first load tests go wrong in predictable ways. Each of these is easy to avoid once you know to look for it.
- Testing with no think time. Real users pause between clicks. A scenario that fires every request back to back generates traffic no human crowd ever would, making the test both harsher and less realistic. Add think time that matches real behavior.
- Reading the average instead of the tail. An average response time of one second can hide a p99 of nine seconds, which means one user in a hundred had a broken experience. Always read p95 and p99, not just the mean. The tail is where load failures live.
- Testing the server but not the page. Protocol-level tests confirm the server answered quickly. They say nothing about whether the page rendered, whether a third-party tag blocked it, or what the visitor actually saw. If user experience is the thing you care about, measure it in a real browser.
- Testing once and never again. Performance regresses quietly with every release. A single load test is a snapshot; the value comes from running it repeatedly and comparing. Put it in your release process, not in a one-off afternoon.
- Testing from one location only. A test run from the same data center as your server will report times no real user sees. If most of your visitors are far from your servers, test from where they actually are, because network distance is part of the load.
How Evaluat handles load testing
Evaluat is a real-browser performance testing platform: it runs each virtual user in its own isolated browser, so the numbers report what controlled browsers recorded under the selected test conditions rather than raw server response time. They do not replace field data across every visitor device. You build a scenario once in a visual editor by recording a real-browser journey, then reuse it across runs.
Because a real browser runs the page, Evaluat captures the three Core Web Vitals (LCP, INP, and CLS), plus FCP, TTFB, page load time, percentile views, and a per-report Apdex score. When something breaks for a slice of users, the run keeps session video, network logs, and console logs for every virtual user. Run from a selected region to include that controlled network path; field data remains the source for the wider customer population.
Here is the honest boundary. For pure API load tests, non-HTTP protocols, or high request volume where you do not need the rendered page, a protocol-level tool like k6 or JMeter is the better fit, because running a real browser per user costs more compute than firing HTTP requests. Most teams use both against different layers of the stack.
You now know what load testing is, why it matters, how a test is structured, and how to size your first run. The next step is small: pick one important journey, such as checkout, and run it at expected peak concurrency. For a planned sale or launch, use a documented peak-readiness target rather than an arbitrary crowd size. Running a Magento store? Start with Magento load testing.
Test in real browsers. Debug in real sessions. Book a demo.