What is capacity testing?
Capacity testing is a type of performance testing that finds the largest load a system can serve while still meeting its performance targets. You raise traffic in steps, check response times and error rates against limits you set in advance, and record the last level that passed. That level is your capacity.
The words that carry the weight are “while still meeting”. The testing profession’s own syllabus puts it the same way. The ISTQB performance testing syllabus says capacity testing determines how many users and/or transactions a given system will support and still meet the stated performance objectives. Microsoft’s long-standing guide to web performance testing gives the purpose of a capacity test in nearly the same words, to determine how many users and/or transactions a given system will support and still meet performance goals.
A restaurant makes the idea concrete. Its capacity is not the number of people who can physically squeeze into the room. It is the number of covers the kitchen can serve while food still reaches the table hot, within twenty minutes of the order. Go past that number and nobody is turned away, but every table waits, and some walk out. The room is full long after the kitchen stopped coping.
A note on the word itself. Searches for “capacity test” also return battery checks, drainage surveys and assessments of a person’s decision-making capacity. This article is about the software kind, run against a website or application under simulated traffic.
Why does capacity testing matter?
Capacity testing matters because both ways of being wrong about capacity cost money. With too little, your busiest hour becomes your slowest, and the cost lands as lost orders. With too much, you pay every month for servers that sit idle. A measured number is the only thing that settles the argument.
The cost of too little is well documented. In the Uptime Institute’s 2026 outage analysis, 57 percent of respondents said their most recent major outage cost more than $100,000, and for the second year running one in five put the figure above $1 million. Slowness counts as well as downtime. In Catchpoint’s SRE Report 2026, 67 percent of respondents agreed that performance degradation is as serious as downtime, up from 53 percent a year earlier.
The cost of too much is quieter. Flexera’s 2026 State of the Cloud survey of more than 750 cloud decision-makers puts wasted cloud spend at 29 percent, the first rise in five years. Cast AI’s 2026 Kubernetes report, drawn from tens of thousands of clusters, found average CPU utilisation of 8 percent in 2025, down from 10 percent the year before. Some of that idle capacity is insurance bought without knowing the size of the risk.
The teams with the most at stake treat capacity as something to measure on purpose. Shopify’s engineers wrote before Black Friday 2025 that they cannot wait for the event to discover their capacity limits, and that they ran five major scale tests at forecast traffic levels between April and October. You do not need Shopify’s scale for the same logic to apply. Can we send the offer to the whole list at once? Can we take the television slot? Do we need the bigger hosting plan? Each of those questions is a capacity question, and each deserves a measured answer.
Capacity testing vs stress testing: what is the difference?
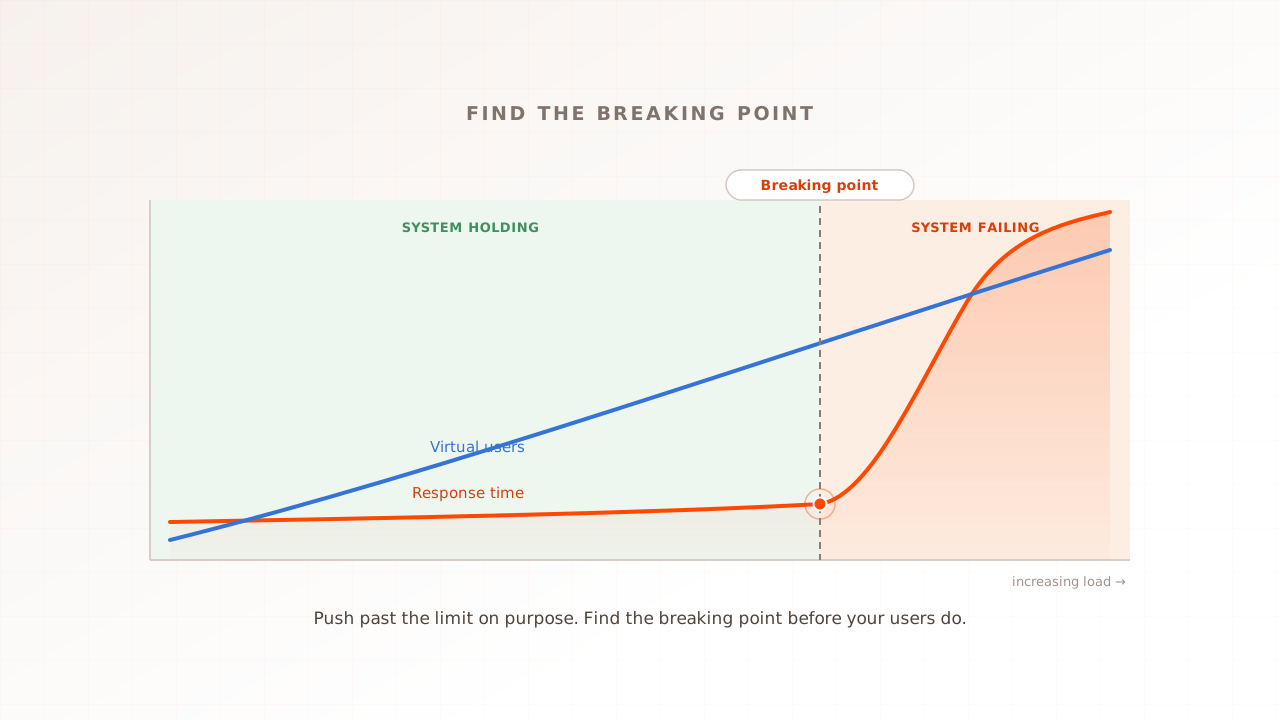
A capacity test stops at the last load level that still meets your targets, so its result is a usable ceiling. A stress test keeps going until something fails, so its result is a breaking point and a picture of how the failure unfolds. They are different numbers, and the gap between them is where customers suffer.
| Capacity test | Stress test | |
|---|---|---|
| Question | How many users can we serve well? | Where does it break, and how? |
| Stops when | A target is missed for the first time | Errors, timeouts or a crash appear |
| Result | A usable ceiling, stated with its targets | A breaking point and a failure mode |
| Used for | Planning, headroom, purchasing | Resilience, recovery, alert thresholds |
| Customer experience at the result | Still good | Already bad for some time |
You should know that the industry does not agree on the name. The k6 documentation notes that the breakpoint test has no clear naming consensus and is also known as capacity, point load, and limit testing in some testing conversations. Even Microsoft’s guide uses both meanings. Its chapter on test types says “still meet performance goals”, while the glossary in its opening chapter says a capacity test determines your server’s ultimate failure point. Neither usage is a mistake. They are two different measurements sharing one label.
We use the meets-targets meaning in this guide because it is the one a business can plan with. Google’s Site Reliability Engineering book states the reason in one line, a slowdown in a service equates to a loss of capacity. A site that answers in six seconds has not kept its capacity just because it is still answering. If a colleague or a tool says capacity and means breaking point, nothing bad happens, as long as you know which number you are holding. The breaking-point method has its own walkthrough in how to stress test a website.
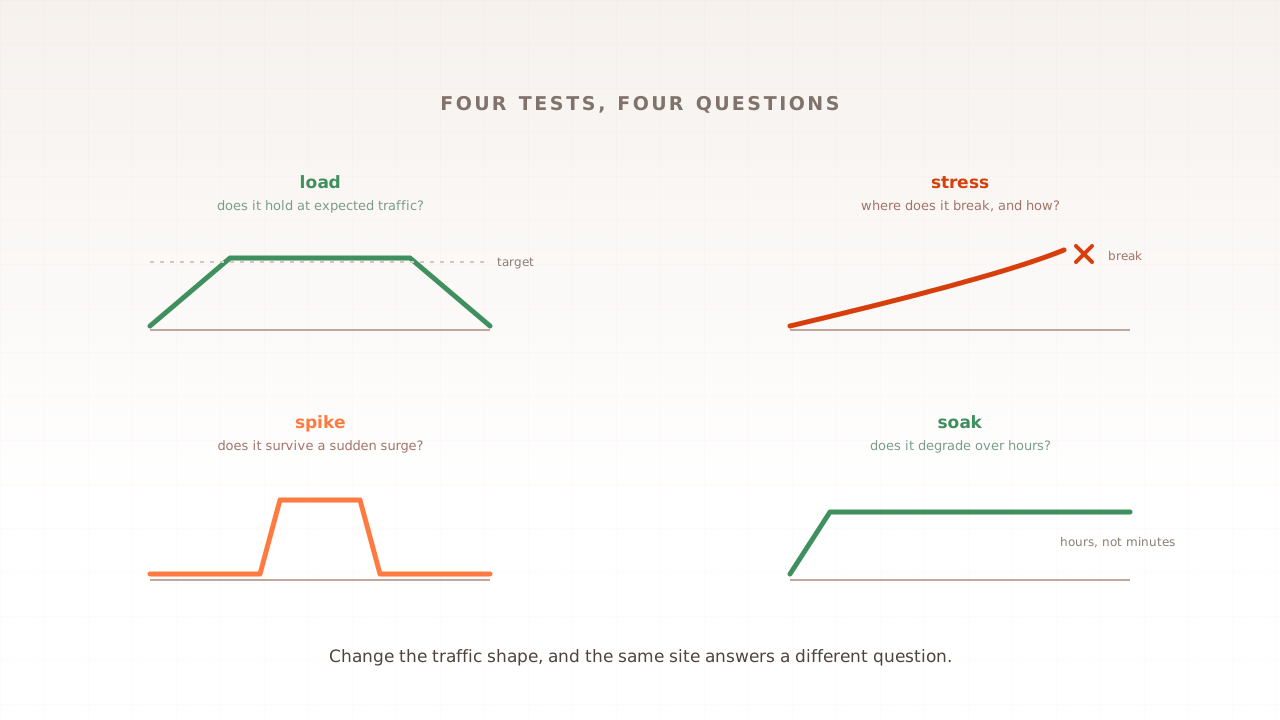
The other neighbours are easier to separate. A load test checks one level, usually your expected peak. A capacity test walks through several levels to find where holding stops. Scalability testing asks whether adding servers raises that ceiling, and it gets its own part later in this guide. The full family is laid out in the types of performance testing.
Where does capacity planning come in?
Capacity planning is the forecast and the purchasing decision, how much traffic is coming and what it will need. Capacity testing is the measurement that checks the plan against reality. Microsoft’s guide describes the two as partners, saying capacity testing is conducted in conjunction with capacity planning, which you use to plan for growth such as a larger user base.
The partnership runs in both directions. The plan supplies the number to test against, which is your forecast peak. The test supplies the number the plan cannot produce by itself, which is what the current system delivers. Google’s SRE book lists regular load testing, to correlate raw capacity such as servers and disks to service capacity, among the mandatory steps of capacity planning. A spreadsheet can tell you how many servers you own. Only a test tells you how many customers those servers can serve well.
How does a capacity test work?
A capacity test works in four moves. Write down what good enough means, step the load up in plateaus, judge every plateau against those written targets, then find which resource ran out first. The example below follows an online store whose forecast peak is 1,000 shoppers on the site at once.
1. Write the pass criteria first
Decide what counts as good enough before any traffic flows. A workable set for the store is three lines long. The 95th percentile of page response time stays under two seconds, checkout steps stay under three seconds, and fewer than one percent of requests fail. The 95th percentile, written p95, is the time that 95 percent of requests beat, so it describes the slow edge of normal rather than the average. Microsoft’s current architecture guidance shows the same pattern, a threshold of 200 milliseconds at the 95th percentile, where any run above it is a fail. Criteria written afterwards tend to fit whatever the chart happened to show.
2. Step the load up in plateaus
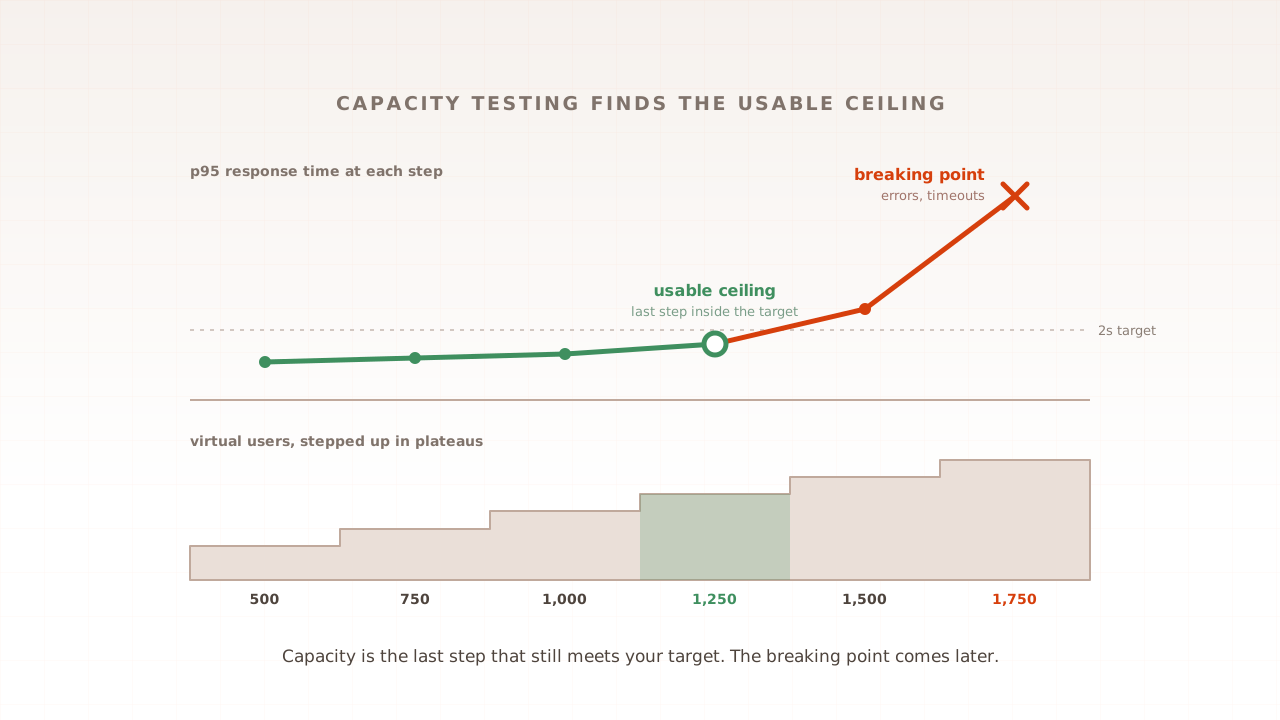
Run the same user journey at rising levels, here 500, 750, 1,000, 1,250, 1,500 and 1,750 virtual users, and hold each level for ten to fifteen minutes. The hold is what makes the reading trustworthy. Caches warm up, connection pools fill, and any autoscaling settles, so the numbers you read describe a steady state rather than a moment of transition. Keep realistic pauses between each user’s actions, exactly as you would in a load test, or each step will be far heavier than its label.
3. Judge every step against the criteria
Read each plateau as a pass or a fail, not as a shape.
| Virtual users | p95 response | Failed requests | Verdict |
|---|---|---|---|
| 500 | 1.1 s | 0.0% | Pass |
| 750 | 1.2 s | 0.0% | Pass |
| 1,000 | 1.3 s | 0.1% | Pass |
| 1,250 | 1.6 s | 0.2% | Pass |
| 1,500 | 2.6 s | 0.4% | Fail, slower than two seconds |
| 1,750 | 6.0 s | 7.0% | Fail, the site is breaking |
These numbers are illustrative, but the pattern is the common one. The store’s capacity is 1,250 concurrent users. Its breaking point is somewhere near 1,750. Between the two lies a band of 500 users in which nothing is down, no alarm fires, and every shopper waits three to six seconds per page. A stress test alone would have reported 1,750 and hidden that band.
State the result in full. “We can serve 1,250 concurrent users with p95 under two seconds and errors under one percent, on this build, in this environment.” A bare user count with no targets and no environment attached is not a capacity figure.
4. Find what ran out
Capacity is set by the first resource to saturate, and it is often not the one people expect. It might be database connections, application workers, a payment or search provider’s rate limit, or plain CPU. Look at your server monitoring for the step that failed and find what hit its limit first. That is your next piece of work, and fixing it is what moves the ceiling.
Why does response time bend before the site breaks?
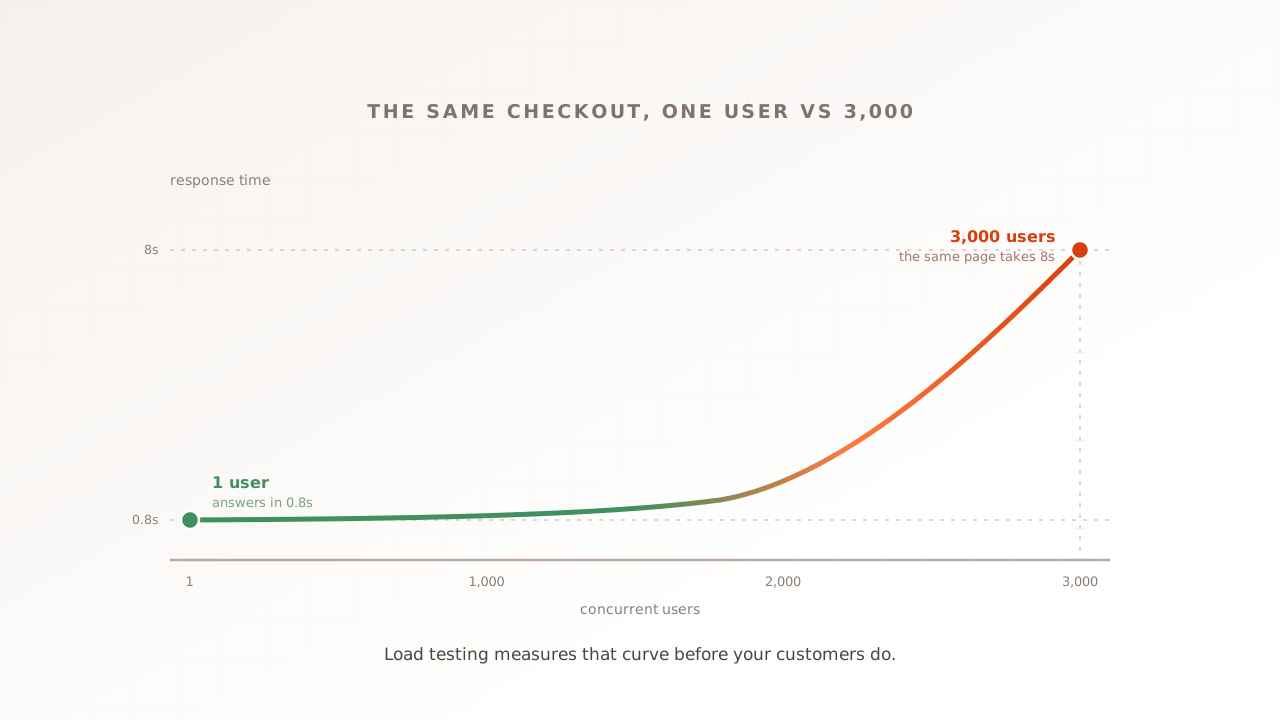
Response time bends early because busy systems queue. While servers have spare workers, a new request is served at once. As the spare workers run out, requests wait for a free one, and the waiting grows much faster than the traffic does. Errors arrive later, when the queues overflow or requests time out.
Think of a supermarket with every till open. At 70 percent busy, a new shopper usually finds a free till. At 95 percent busy, most shoppers queue, even though the store is serving only a third more people than before. Google’s SRE book puts the engineering version plainly, many systems degrade in performance before they achieve 100% utilization. This is why a capacity figure sits below the breaking point, and often well below.
Engineers often call the bend the knee of the curve. It is a useful picture and a poor measuring instrument. The performance analyst Neil Gunther has pointed out that the term knee is not a well-defined term in mathematics, and where the bend appears on a chart depends on how the axes are drawn. That is the practical reason to write criteria first and read each step as pass or fail.
Two cautions keep the reading honest. First, most load tools by default hold a fixed number of virtual users, and each one waits for a response before its next step. When the site slows, the test itself sends fewer requests, which flatters the result. Real crowds do not wait their turn. Gatling’s documentation describes such arrival-driven traffic as an open system and notes that most websites behave this way. So watch completed journeys per minute at each step as well as response time. Second, autoscaling moves the ceiling while you measure it. The k6 documentation warns that in an elastic cloud a test of this kind can end up finding only the limit of your cloud account bill. Pin the scaling limits for the duration of the test, or measure what one unit can serve and how long a new unit takes to arrive.
How much headroom should you keep above your forecast peak?
Keep enough headroom that a forecast error or a stronger promotion does not push you past the ceiling. For most online stores that means capacity 20 to 50 percent above the forecast peak. In the example, a capacity of 1,250 against a forecast of 1,000 gives 25 percent, which is workable and not generous.
The forecast comes from your own analytics, as peak-hour sessions multiplied by average session minutes, divided by 60. The Black Friday plan in part 1 walks through that arithmetic, and part 7 of this guide turns it into a calculator. Once you hold both numbers, the comparison writes your plan.
| Capacity compared with forecast peak | What it means | What to do |
|---|---|---|
| Below the forecast | The peak will be slow, or will fail | Fix the first bottleneck and retest, or plan a waiting room |
| Up to 20 percent above | It holds only if the forecast is exactly right | Treat it as unfinished, fix and retest |
| 20 to 50 percent above | A sensible operating margin | Freeze changes before the peak and verify once more |
| Far above | You may be paying for idle servers | Check whether you can scale down outside peak periods |
The bands are judgement rather than law. Use the higher end when discounts are deeper than last year, when the forecast rests on thin history, or when a slow hour would be unusually expensive.
Common mistakes with capacity testing
Most capacity testing mistakes come from measuring the wrong number or trusting the right number for too long. Each of these has a one-line correction.
- Reporting the breaking point as capacity. “It survived 1,750 users” describes the point where the experience was already ruined. Report the last step that met your targets.
- Testing without written criteria. If good enough is decided after the run, the chart decides it for you. Write the three lines first.
- Steps that are too short. A two-minute plateau measures warm-up, not steady state. Hold each level for ten minutes or more, and never read capacity off a continuous ramp.
- Testing one page instead of a journey. A cached homepage can serve enormous traffic while checkout gives way at a fraction of it. Test the path that earns money.
- Treating the number as permanent. Capacity belongs to one build on one environment. New code, a bigger catalogue or a smaller database plan all move it, so retest before every peak and after every large release.
- Judging only the server. A server can answer inside its target while the page a customer sees arrives late, because of a slow third-party service or a heavy script. Include a measure of what the visitor sees in your criteria.
How Evaluat handles capacity testing
In Evaluat a capacity test is the same scenario run at rising targets. Each run has its own ramp-up, steady state and ramp-down, so every level gets a clean plateau to read. Build a scenario once. Use it everywhere. The journey you recorded for a load test serves the capacity test unchanged.
Because every virtual user is an isolated real browser, your pass criteria can describe what a customer sees, for example Largest Contentful Paint under 2.5 seconds on product pages at each level, alongside p95 response time and error rate. Each report carries percentiles from p50 to p99, an Apdex score with thresholds you choose, and performance per URL. When a level fails, you can open the individual sessions from it, with video, network logs and console logs. A failure at peak isn’t a percentile. It’s a session.
Two boundaries are worth stating. Real browsers cost more to run per user than protocol-level tools, so for the raw ceiling of an API at very high concurrency, a protocol tool is the cheaper instrument, and many teams use both. Evaluat is also not server monitoring. It shows you what customers experienced at each level, and you still need your own infrastructure monitoring to see which resource ran out. The mechanics are on the performance testing product page.
Capacity testing, then, gives you a number you can plan with. It is the last level of load at which your site is still good, stated with its targets and its environment, measured before the peak rather than during it. Hold it next to your forecast and you know whether you have headroom, a work list, or a bill for servers you do not need.
Test in real browsers. Debug in real sessions. Book a demo and we will size a capacity test to your forecast peak with you.