What are concurrent users?
Concurrent users are the people who have a visit in progress on your website at the same moment. Some are loading a page, most are reading or typing, and all of them count. It is a snapshot measure, unlike visitors or sessions, which are totals over a day or an hour.
A supermarket is the easiest picture. Visitors per day is everyone who came through the door. Concurrent users is everyone in the shop right now, whether they are at a till or reading a label in aisle four. The tills, the aisles and the car park are all sized for the second number.
The term has two neighbours worth separating. In software licensing, concurrent users means how many seats may be logged in at once, which is a contract matter and not the subject here. In testing, simultaneous users means people performing the same action at the same instant, such as 200 shoppers pressing the pay button together. That is a way to design one harsh test step. It is not a traffic measurement.
A virtual user is the testing counterpart of a concurrent user, one simulated visitor standing in for one real one. A well-sized load test sets its virtual user count from your real concurrency.
How do you calculate concurrent users?
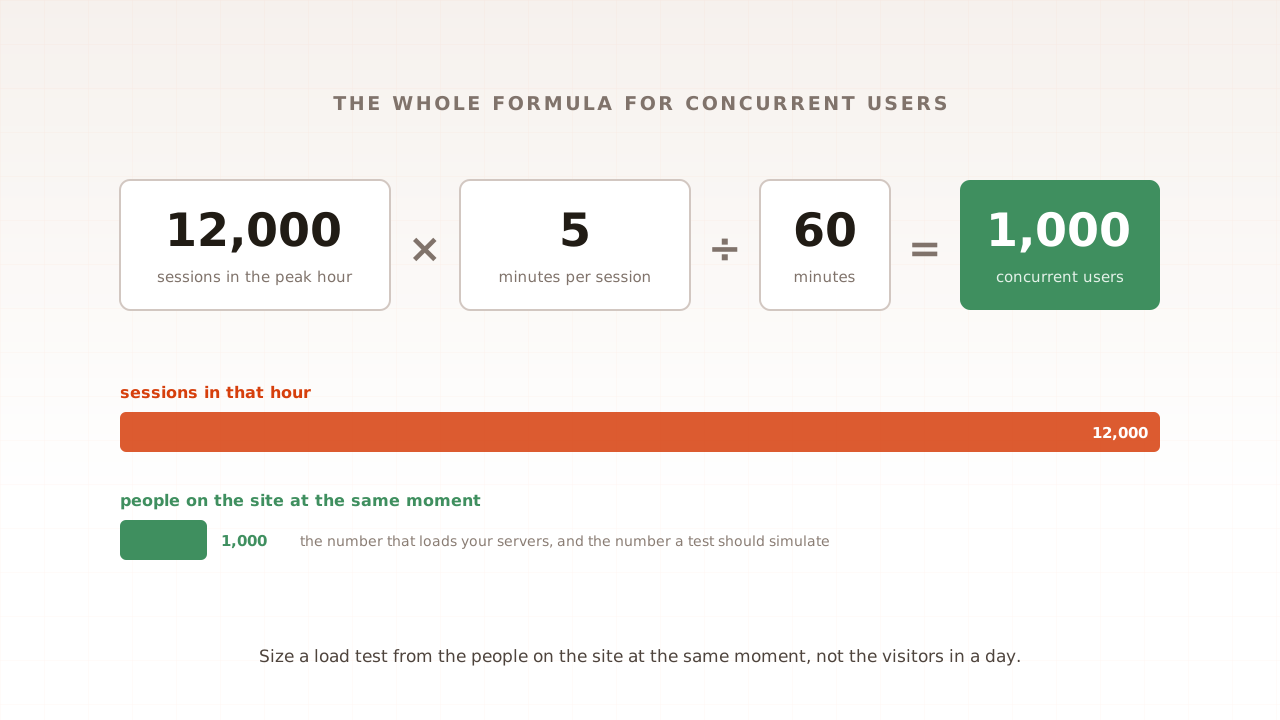
Multiply the sessions in your busiest hour by the average session length in minutes, then divide by 60. A store with 12,000 sessions in its peak hour, each lasting five minutes, carries 12,000 multiplied by 5, divided by 60, which is 1,000 concurrent users. That is the whole formula.
It is not a rule of thumb. It is Little’s law, one of the most widely used results in queueing theory. John Little’s own summary, written for the law’s fiftieth anniversary, is that the average number of items in a queuing system equals the average arrival rate multiplied by the average time an item spends in the system. Swap items for visitors, arrival rate for sessions per minute, and time in the system for session length, and you have the formula above. The k6 documentation gives the same arithmetic as hourly sessions multiplied by average session duration in seconds, divided by 3,600.
Both inputs come from your analytics, and three details decide whether the answer is right.
Use the busiest hour, not an average. A site with 100,000 sessions a day does not receive 4,167 every hour. Find the busiest hour of your busiest recent day. The k6 documentation warns that daily averages can mask significant traffic variations that occur throughout the day.
Know what a session is. In Google Analytics 4, a session ends after 30 minutes of user inactivity by default. Use the average session duration metric. Average engagement time counts only the moments your page was in the foreground, so it gives a lower figure.
Do not read concurrency off the Realtime report. Google describes its headline card as all users on your site or app in the last 30 minutes. That counts everyone who was active at any point in the half hour. With five-minute sessions it comes out around six or seven times higher than the number of people present at any one moment.
One more caution. The formula gives the average across the hour, and some events compress demand into minutes. When the British Museum opened ticket sales for its Bayeux Tapestry exhibition in July 2026, the online queue reached a peak of over 80,000 and the website saw 4.7 times its average daily traffic. For an on-sale moment, size from the people you expect in the first ten minutes rather than the first hour.
A concurrent users calculator you can run on paper
The calculator is five lines. Fill in the first two from your analytics, and the rest is arithmetic. The worked column uses the store from the section above.
| Line | What to enter | Example |
|---|---|---|
| A | Sessions in your busiest hour | 12,000 |
| B | Average session duration, in minutes | 5 |
| C | Concurrent users at peak, A multiplied by B, divided by 60 | 1,000 |
| D | Headroom for growth and promotions, 20 to 50 percent | 30% |
| E | Load test target, C plus D | 1,300 |
If you would rather look the answer up, this table gives line C for common inputs.
| Sessions in busiest hour | 2 min sessions | 3 min | 5 min | 8 min | 10 min |
|---|---|---|---|---|---|
| 1,000 | 33 | 50 | 83 | 133 | 167 |
| 2,500 | 83 | 125 | 208 | 333 | 417 |
| 5,000 | 167 | 250 | 417 | 667 | 833 |
| 12,000 | 400 | 600 | 1,000 | 1,600 | 2,000 |
| 25,000 | 833 | 1,250 | 2,083 | 3,333 | 4,167 |
| 50,000 | 1,667 | 2,500 | 4,167 | 6,667 | 8,333 |
| 100,000 | 3,333 | 5,000 | 8,333 | 13,333 | 16,667 |
Use your own session length if you have it. If you do not, Contentsquare’s 2026 benchmark of 99 billion sessions across 6,500 websites reports 4 minutes 46 seconds per session on desktop and 2 minutes 20 seconds on mobile, so a store with mostly mobile traffic sits nearer the two and three minute columns.
Headroom, line D, is a judgement. The Black Friday plan in part 1 uses 20 to 50 percent, with the higher end when discounts or advertising are heavier than last year. If you only know daily traffic, estimate the busiest hour first. Assuming for illustration that it carries 10 percent of the day, a site with 10,000 daily sessions of five minutes has about 83 concurrent users at peak. Replace the 10 percent with your own figure as soon as you can.
Concurrent users vs requests per second: which number is which?
Concurrent users counts people. Requests per second counts the calls their browsers make. The two are connected by how often each person clicks, and confusing them is the most common way to misread a load test or a hosting plan. One thousand concurrent users do not produce one thousand requests per second.
| Number | What it counts | Time frame | Where you meet it |
|---|---|---|---|
| Daily visitors | People who came | A day | Business reports |
| Sessions per hour | Visits that started | An hour | Analytics |
| Concurrent users | People present | An instant | Load test sizing |
| Requests per second | Calls to your servers | A second | Server and test reports |
| Requests in progress | Calls being worked on | An instant | Server capacity limits |
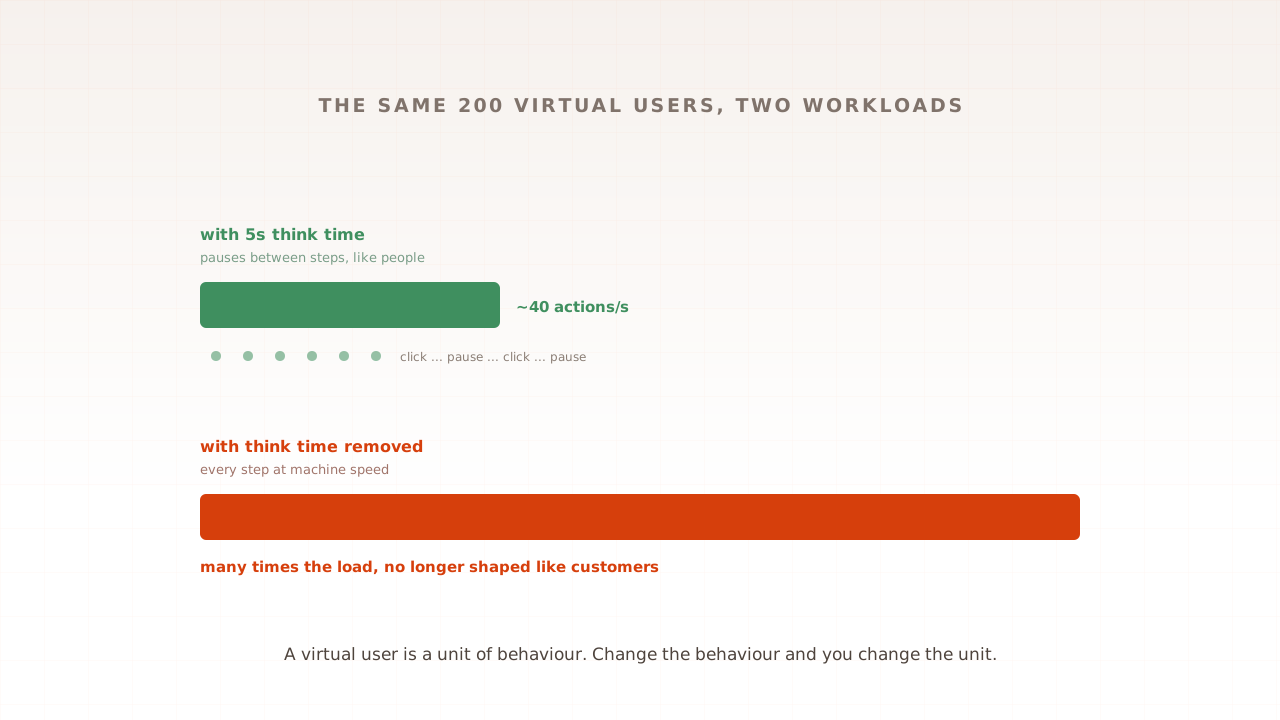
The conversion runs through think time, the pause between one action and the next. An old Sun deployment guide gives the formula cleanly, requests per second equals the number of users divided by response time plus think time, and its own example turns 2,800 users with a one second response and three seconds of think time into 700 requests per second.
Apply it to our store. Its 1,000 concurrent shoppers click roughly every ten seconds, and pages answer in half a second. That is 1,000 divided by 10.5, or about 95 page requests per second. At any instant, the number of requests actually being worked on is 95 multiplied by 0.5 seconds, which is about 48.
So a crowd of 1,000 people is, from the server’s side, fewer than 50 requests in progress at once. Each page request also triggers requests for images, scripts and styles, but those are usually served from a cache or a content delivery network and never reach your application.
How many concurrent users can your website handle?
You cannot read the answer off a server specification. The limit depends on how many requests your application can work on at once, how long each one takes, and how much of your traffic is served from cache. The first is a setting, the second changes as the site gets busy, and the third depends on what your visitors do.
Many web applications, including most PHP, Ruby and Python stacks, process requests with a fixed pool of workers. In PHP-FPM, a common way to run PHP, the setting is called pm.max_children, and the PHP manual says it sets the limit on the number of simultaneous requests that will be served. Other stacks have the same idea under different names, such as threads, processes or connections.
The managed host Kinsta publishes the arithmetic plainly. If an average response takes 250 milliseconds, each thread can process four requests per second, and with eight threads the theoretical maximum throughput is 32 requests per second. Its rule for sizing is that the threads you need are roughly uncached requests per second multiplied by average execution time. The same article notes that cached requests skip this process entirely, which is why cache hit rate matters more than any other factor.
Run that on the store. Suppose 30 percent of its 95 page requests per second cannot be cached, because they are cart, checkout, search and account pages. That is about 29 requests per second, each taking half a second, so about 14 workers are busy at any moment. A pool of 40 workers looks comfortable.
Now let those uncached pages slow to three seconds under load, which is common once a database starts to queue. The same 29 requests per second now hold 29 multiplied by 3, or about 86 workers. The pool of 40 is exhausted, new requests wait in line, and the wait makes every response slower still. Nothing about the crowd changed. The same 1,000 people became six times heavier because each request took six times longer.
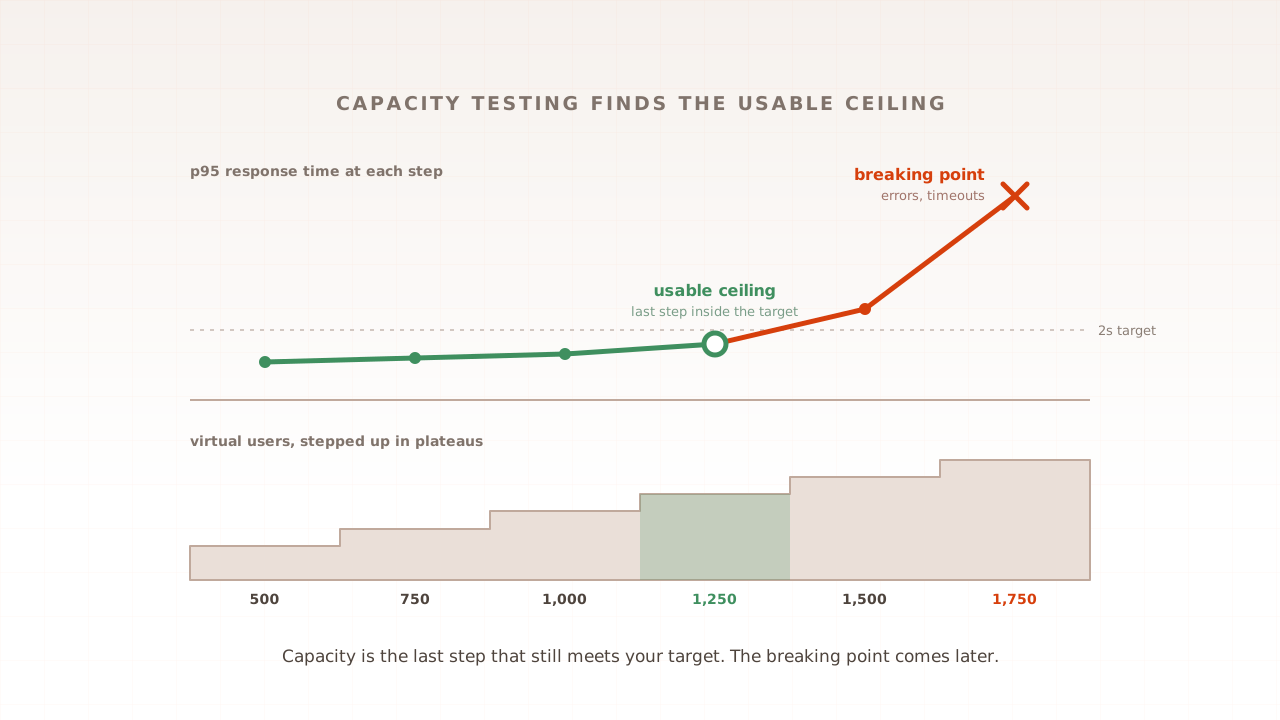
This is why we will not give you a table that maps hosting plans to user counts, and why you should be wary of any that does. The honest answer to “how many can it handle” is a measurement. A capacity test raises the load in steps and records the last level at which your site still meets its speed targets.
What happens to concurrency when the site slows down?
Concurrency rises when the site slows down, even if no extra visitors arrive. Little’s law explains why. Concurrent users equals arrival rate multiplied by time on site, and a slow site keeps every visitor on it for longer. The crowd grows because nobody can leave.
Take the store at 12,000 sessions an hour. If slow pages stretch the average visit from five minutes to six, concurrency climbs from 1,000 to 1,200 with no change in demand. Those 200 extra people add their own requests, which slows the site further. Traffic charts during an incident can show exactly this pattern, with active users climbing while orders per minute fall.
Load testing tools describe the difference as open and closed systems. In a closed model a fixed number of virtual users each wait for a response before acting again. In an open model new visitors keep arriving regardless, and the k6 documentation notes that in this model the response times of the target system no longer influence the load on the target system. Gatling’s documentation says of open systems that most websites behave this way. The practical lesson for a first test is to watch completed sessions per minute as well as the virtual user count, as covered in how to load test a website.
Common mistakes with concurrent users
Almost every mistake with concurrent users is a unit mistake, a number counted over one time frame and used as if it were another. These are the ones that distort test plans and hosting decisions most often.
- Typing daily visitors into the tool as users. Ten thousand visitors a day is closer to 80 people at once than to 10,000. Convert through the busiest hour first.
- Using an average hour. Sites are sized by their busiest hour and fail in it. An average hour describes a moment that matters to nobody.
- Reading the Realtime card as concurrency. Active users in the last 30 minutes is a half-hour total. Divide it by six or seven for five-minute sessions, or better, use the formula.
- Treating users as requests. A thousand users is around 95 page requests per second at human pace. A tool set to 1,000 requests per second is simulating roughly ten times that crowd.
- Trusting a plan that “supports 50,000 visitors”. A monthly visitor figure says nothing about concurrency, and nothing about your checkout.
- Forgetting the traffic analytics cannot see. Bots, crawlers and visitors who decline tracking all reach your servers without appearing in your sessions. Treat the calculated figure as a floor.
How Evaluat handles concurrency
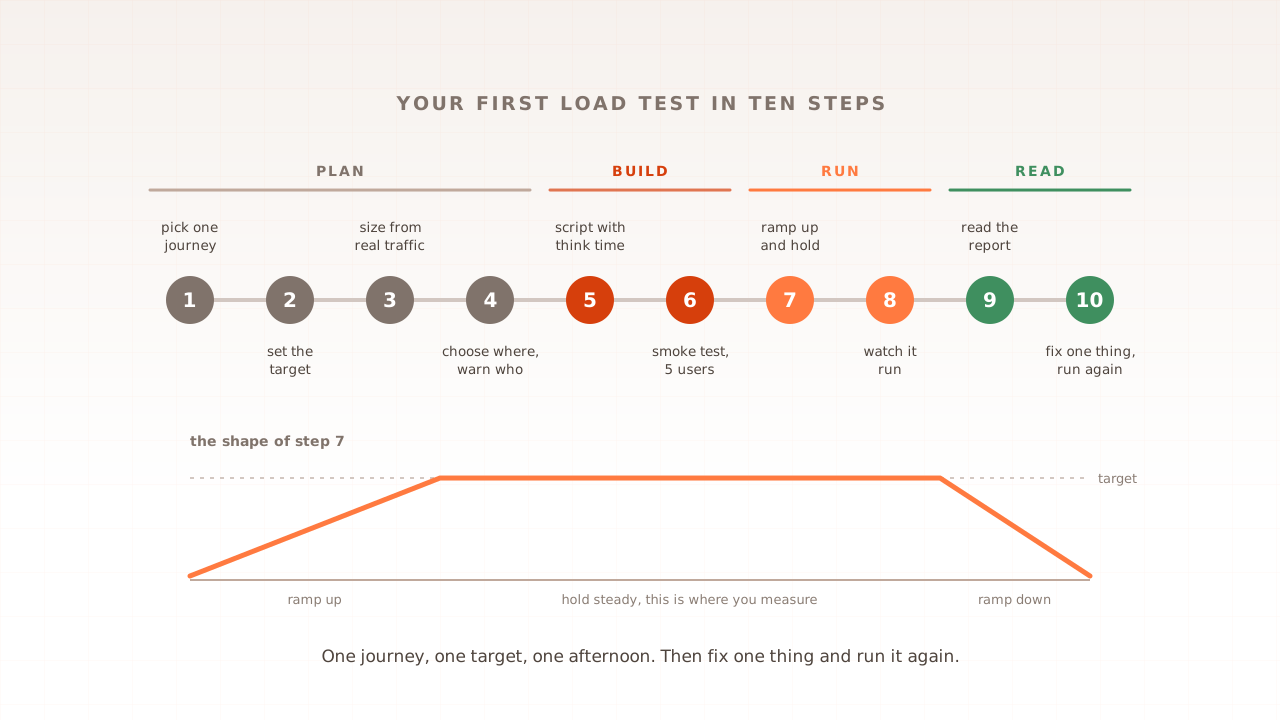
In Evaluat you set the concurrent target directly. A test has a number of users and a duration, with the ramp-up, steady state and ramp-down configured separately, and each of those users is an isolated real browser working through your journey at human pace. Every virtual user is a real browser. We size the run to your forecast peak with you, using the arithmetic on this page.
Because each user is a browser, the report shows what concurrency did to the experience as well as to the servers. You get Core Web Vitals per URL, response time percentiles from p50 to p99, error rates, and a video with network and console logs for any session you want to inspect. That matters for the question this article asks, because a site can keep answering while the page a customer sees arrives late.
The boundary is cost per user. A real browser needs far more compute than a scripted HTTP client, so for tens of thousands of users against an API, a protocol-level tool is the better instrument, and many teams run both. The details are on the performance testing product page.
Concurrent users, then, is the people present at one moment. You calculate the number you expect from two lines of analytics, and you measure the number you can carry with a test, because the second one moves as the site gets busy. Work out the first today. It takes five minutes and it changes what every later number means.
Test in real browsers. Debug in real sessions. Book a demo and we will work out your concurrent user target with you.